
NiFi for Log Modernization
In this article, I delve into the crucial role that logs play in system administration, troubleshooting, and analytics, highlighting their importance in a typical enterprise setting. I introduce Cloudera Flow Management, based on Apache NiFi, as an effective tool for managing log ingestion, routing, and transformation. I discuss various NiFi processors that facilitate the efficient ingestion and transformation of logs, making them more standardized and usable. Finally, I cover the utility of real-time dashboards for monitoring operational metrics and customer experience, showcasing how all these elements integrate to form a comprehensive log management strategy, built on NiFi.
Any techy knows how significant logs are to an infrastructure. Logs serve as the eyes and ears of system administrators, engineers, and security experts. They provide monitoring, troubleshooting, auditing, and analytics for experts looking to debug or get actionable alerts from their infrastructure. In particular, system, application, access, performance, security, and audit logs are just a few of many that comprise a typical enterprise deployment. Today, we recognize logs from many different sources. Operating systems, network hardware, applications, and even third-party services all generate logs that must be kept for purpose-built, business processes, compliance, or simply posterity. Massive debug logs and warnings tend to clog up space and provide very little actionable data though are very necessary for any computing environment. Because of this, optimizing both log ingestion and analysis is paramount for a cost mindful business to take actions when necessary and only keep the needed log material.
Cloudera Flow Management, which is built from the Apache NiFi project, helps a business ingest, route, enrich, and transform data from a variety of sources, such as logs. NiFi is highly configurable and scalable, which makes it a good fit for dealing with log data for analytics, monitoring, or insight. It also fits over the rest of the CDP product stack so you can take advantage of the other ETL tools inbuilt with the platform such as Cloudera Data Warehouse which lets you perform SQL queries on the data, and Cloudera Data Visualization, which lets you add accompanying dashboards.
Below is an example flow, where I optimize reducing the amount of log data from Splunk indexers that ultimately gets forwarded to Splunk, and grab some attributes to load into HDFS:
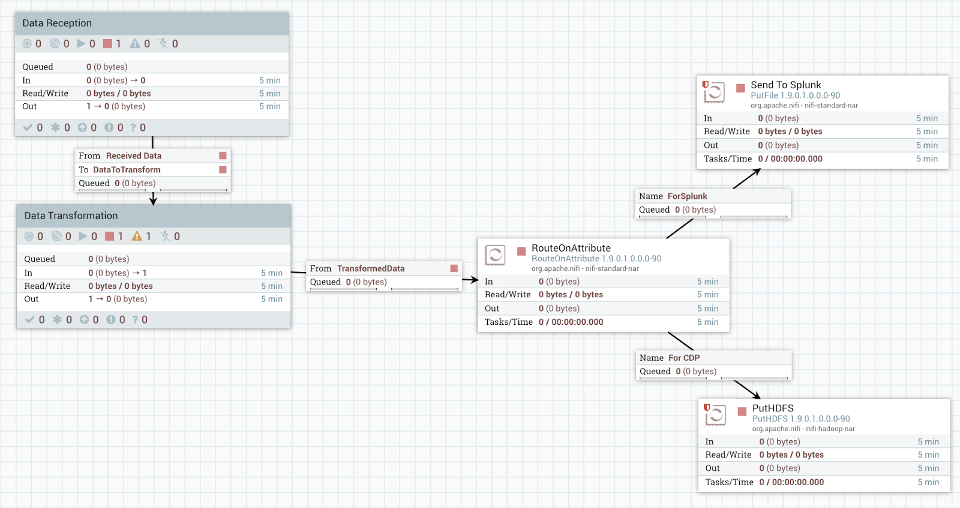
As you can see, NiFi flows are based on the concepts of processors that have connections link one processor to another. These processors and connections sit inside of a FlowFile, such as the one demonstrated above, and each FlowFile serves as a template for solving a technical process. Below, I cover several components of a potential flow and highlight a few examples in the context of a log analysis use case.
Ingestion
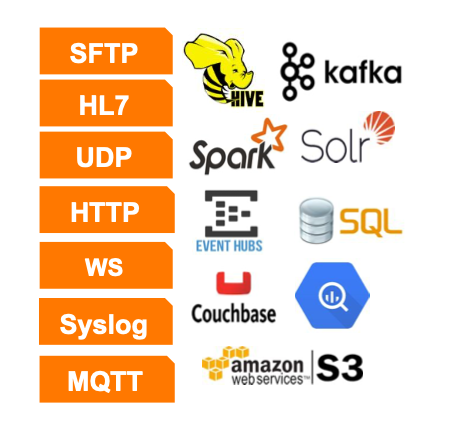
On the ingestion side, NiFi offers several processors that help the flow designer ingest logs (these are just a few of many):
- TailFile Processor: This processor can read files as they are updated. This is useful for continuously ingesting logs that are being written to a file.
- GetFile Processor: For collecting existing log files from directories.
- ListenSyslog Processor: To ingest Syslog messages directly.
- ConsumeKafka Processor: If your logs are being streamed to a Kafka topic, you can use this processor to consume those logs.
- HTTP-based ingestion: NiFi can also ingest logs sent over HTTP/HTTPS.
NiFi recognizes an incredibly large amount of sources. It’s likely that if you can think of a data source, there is some way to “flow” it through NiFi.
Transform
For transformations, NiFi has processors which help the flow designer ensure a standardized format for the incoming log data (again, these are just a few of many):
- RouteOnAttribute: Use this processor to route data based on specific conditions or attributes, which can be handy for segregating different types of logs.
- SplitText: To split log files into individual lines or chunks that can be processed separately.
- ReplaceText: For replacing specific text in the logs. This can be useful for redaction or formatting.
- ExecuteScript: For advanced transformations, you can write custom scripts in languages like Groovy, Python, or Ruby.
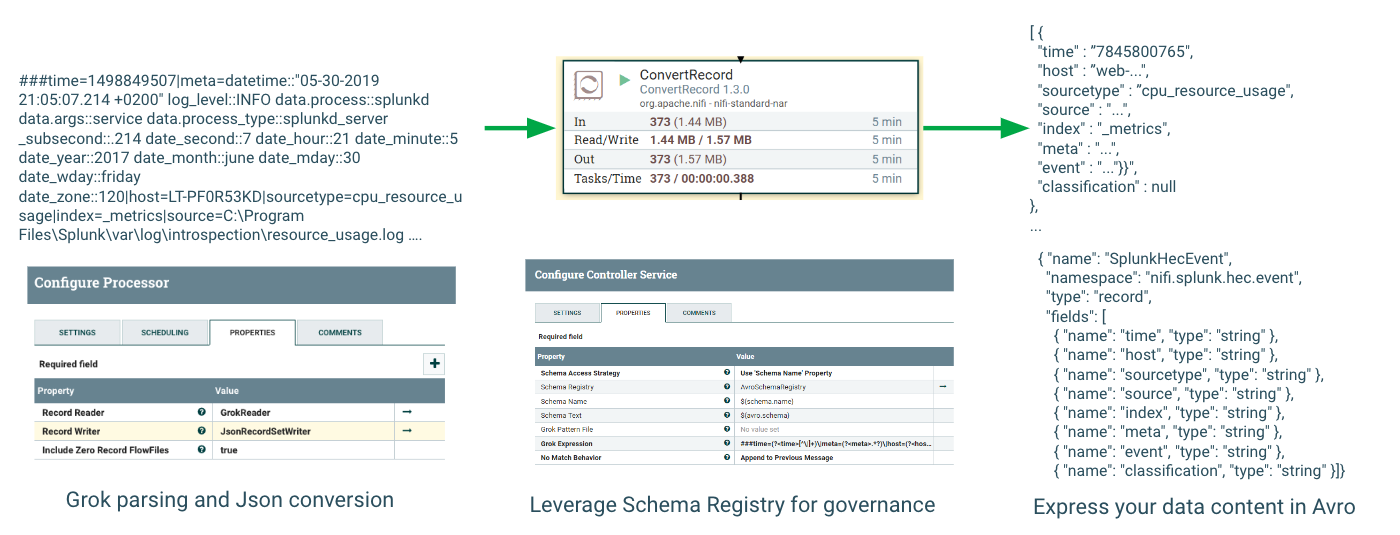
- ConvertRecord: This can be used for converting logs from one format to another (e.g., from JSON to Avro).
- AttributesToJSON: Convert attributes to a JSON format to make it easier for downstream analytics tools to process the logs.
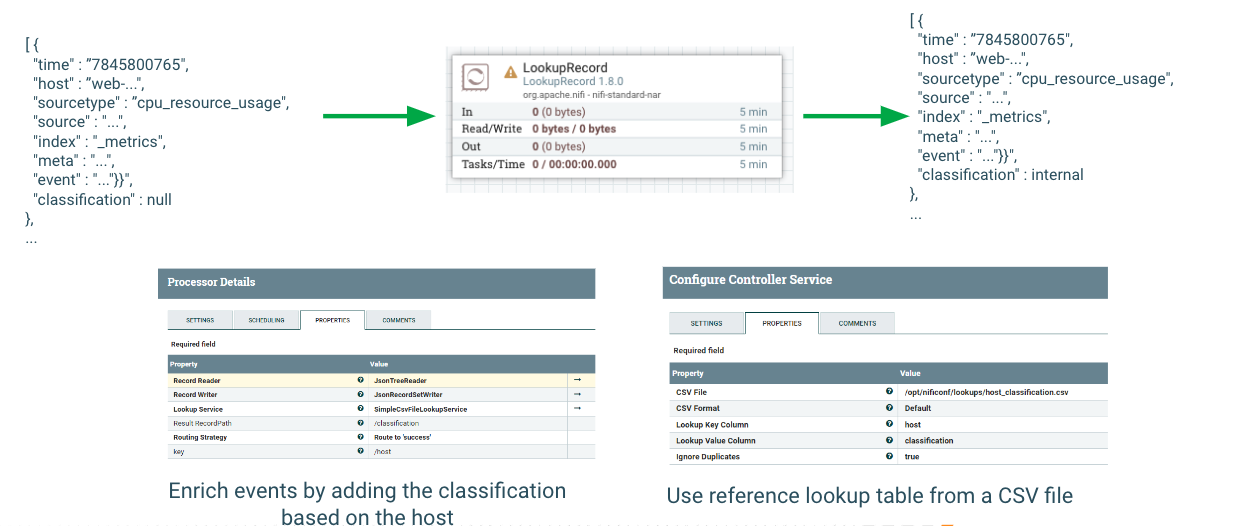
How you choose to handle transforming your data is up to you. Here is an example of using NiFi to enrich a piece of event data using the LookupRecord processor.
Additionally, you may want to change the format and type of the data. Here is an example of transforming JSON to Splunk HEC format.
After transforming the logs to a usable schema and record type, the flow designer can choose to take one (or more) of the following paths:
Insights (I am only putting a few processors/ideas here, there are a TON!)
- PutElasticsearch: If you’re using Elasticsearch for log analytics, you can directly put your transformed logs into an Elasticsearch index.
- PutSQL Processor: You can put logs into a relational database, which can then be queried for insights.
- PutIceberg: Allows you to parse and load records into Iceberg tables and take advantage of Open data lakehouse techniques through data stored in the Iceberg table format.
- PublishKafka: Transformed logs can be published back to Kafka for real-time analytics or for being consumed by other applications.
- Trend Analysis: With historical log data, you can perform trend analysis to identify long-term patterns, opportunities, or risks.
- KPI Monitoring: Define and monitor business KPIs that are derived from log data, perhaps integrating this data with existing BI tools.
- PutSplunk: This processor forwards data to a Splunk instance from FlowFiles as events, providing a seamless way to pipe data from NiFi to Splunk for further analysis.
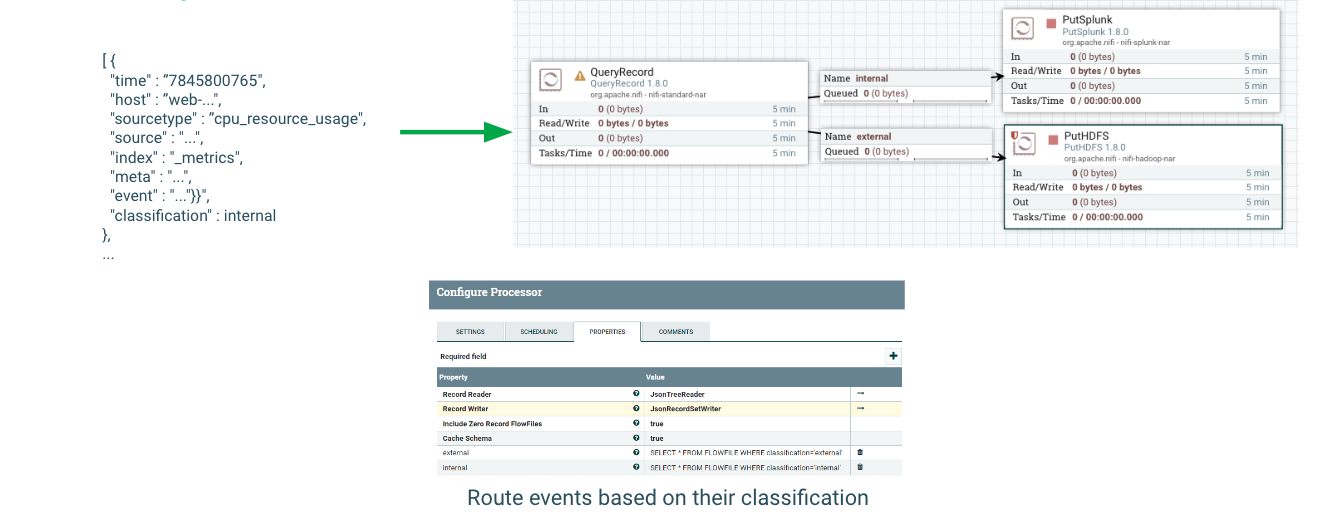
How you choose to route the transformed data is also up to you. Here is an example where a reduced amount of data is being sent to Splunk indexers, and other data of relevance is being routed to HDFS.
Monitoring and Alerts
These are incredibly helpful for immediate insights. They are typically linked to a KPI or some kind of alert that needs action. (As a bonus, you can also set up ML processes to trigger based on the alert as well.)
- MonitorActivity: This processor can detect changes in data flow rates and can generate alerts.
- PutEmail: Using the PutEmail processor, you can set up email notifications for specific triggers.
Machine Learning and Decision Automation
This pairs well with the monitoring and alerts piece I just mentioned. Oftentimes you need to have an action take place immediately if some kind of event occurs. ML helps enable this, dragging down lag and enabling real-time responses.
- Anomaly Detection: Process your logs through machine learning models to automatically detect unusual patterns that might signify security threats or operational issues.
- Predictive Maintenance: Use historical logs to predict when hardware or software is likely to fail, so that you can proactively address issues.
- Auto-Remediation: Based on specific log events or patterns, you can trigger automated workflows to correct or mitigate issues without human intervention.
- Feedback Loops: Use log data to automatically adjust system settings or configurations, creating a self-optimizing system.
Real-Time Dashboards
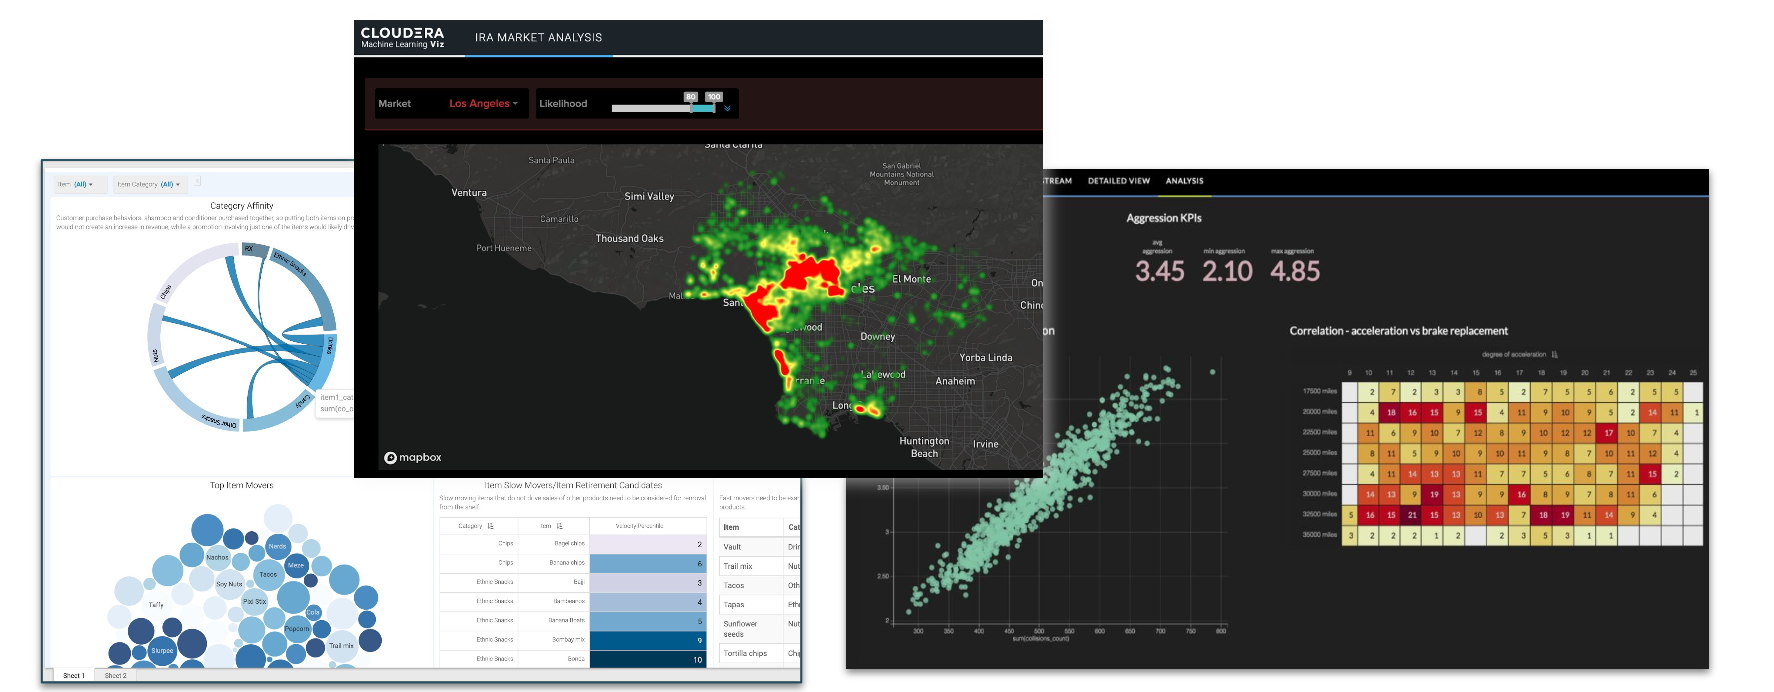
I am calling out dashboards specifically because of how well NiFi plays with Cloudera Data Visualization (CDV). This is a product which pairs with all the others to ensure the data analyst can get visual, interactive, custom dashboards and applications.
- Operational Metrics: Build real-time dashboards that showcase key operational metrics derived from logs, helping in immediate decision-making.
- Customer Experience: Create dashboards to monitor customer interactions and experience in real-time, utilizing log data from web servers, applications, etc.
Want to Read More and Get Started?
If any of the features I discussed sound interesting to you, I would encourage you to check out the links below and get hands on.
